Menu
Department of Buildings Safety Violations
Introduction:
- This project focuses on analyzing safety violations data from the New York City Department of Buildings to uncover patterns and predict future violations. By applying various machine learning models, the project aims to enhance the understanding of factors leading to safety breaches and provide data-driven recommendations to improve building safety and compliance.
Steps taken:
- Project Planning
- Data Collection
- Data Preprocessing
- EDA(Exploratory Data Analysis)
- Feature Engineering
- Modelling
- Final Evaluation
Project Planning
Problem Statement:
- The New York City Department of Buildings (DOB) is in charge of overseeing the safety and integrity of construction and building operations throughout the city. However, the number and types of safety infractions registered by the agency varied significantly across locations, equipment, and building types.
- The goal of this research is to extract insights from the DOB Safety Violations dataset by recognizing trends in violation occurrences, determining their categories, and predicting future violations with machine learning algorithms. The ultimate goal is to make recommendations that can help the DOB enhance safety compliance and avoid future infractions.
- The business need for this project is to assist the New York City Department of Buildings in managing and mitigating safety issues. By integrating data analytics and machine learning, the department may identify high-risk areas, optimize inspection processes, and improve regulatory compliance, resulting in safer building environments and lower expenses associated with safety breaches.
Data Collection
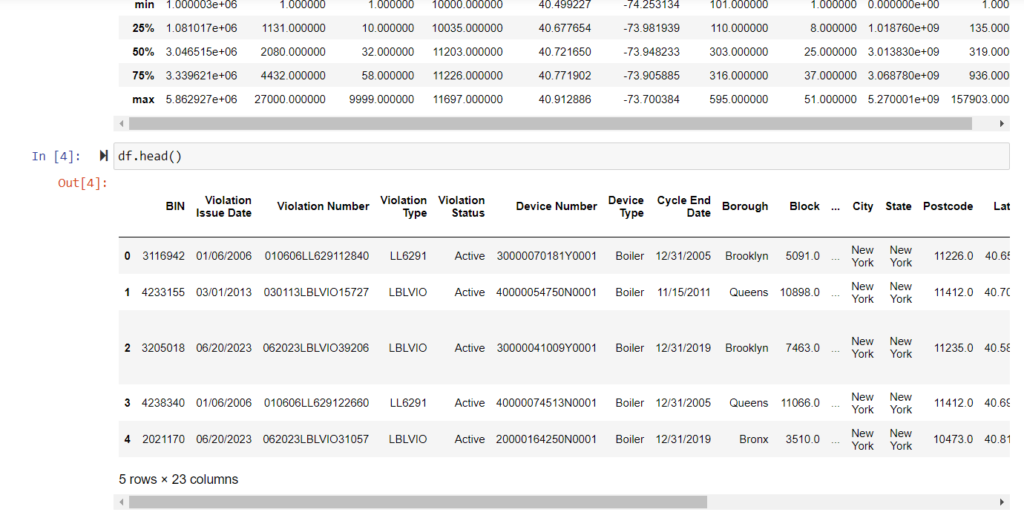
This data set includes violations issued on devices through the New York City Department of Buildings’ DOB NOW: Safety Violations module. The data is collected because the Department of Buildings tracks violation issuance and related information. This data includes items such as violations number, violations type, violation issuance data, and BIN.
Data Preprocessing
EDA(Exploratory Data Analysis):
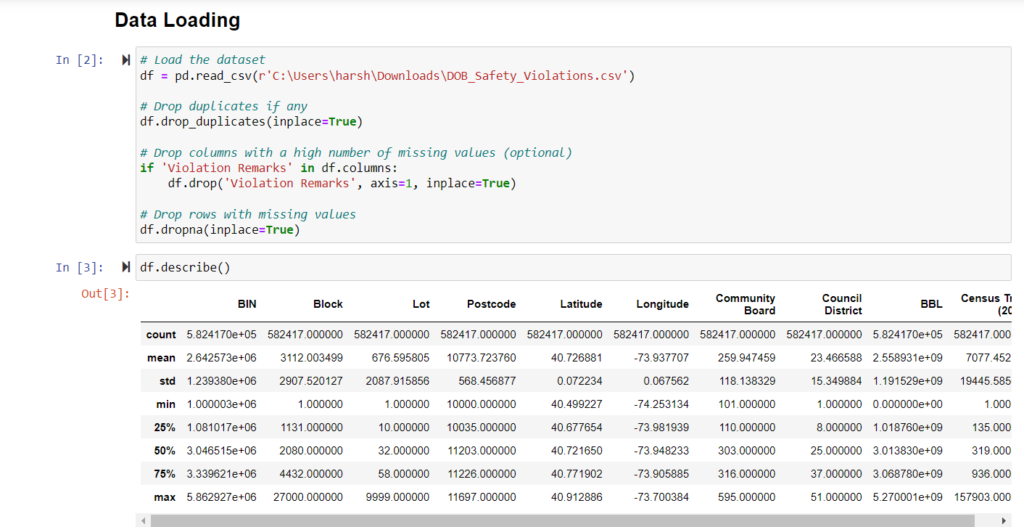
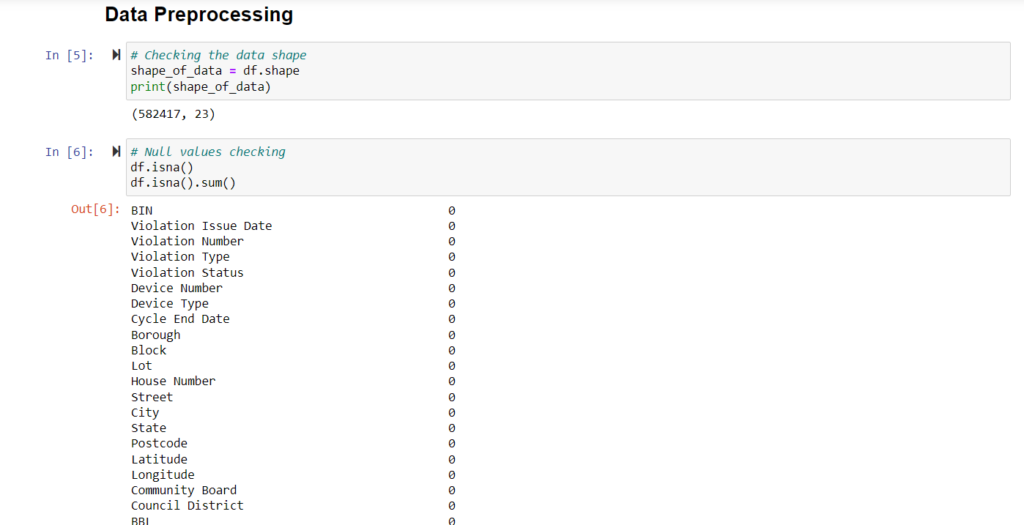
- Exploratory Data Analysis (EDA) is a vital part of this research that aims to discover insights and trends in the DOB Safety Violations dataset. The dataset initially required extensive cleaning, which included removing duplicates, lowering columns with a high number of missing values, and removing rows with missing data. These pretreatment methods ensured that the analysis was carried out on a stable and consistent dataset.
Data Distribution and Summary Statistics:
- We started by looking at basic summary statistics such the numeric variables’ means, medians, and standard deviations. This provides a summary of the data’s main trends and variability. The dataset’s shape and structure, including the number of records and features, were also evaluated to determine its breadth.
Correlation Analysis:
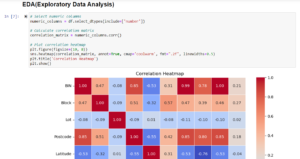
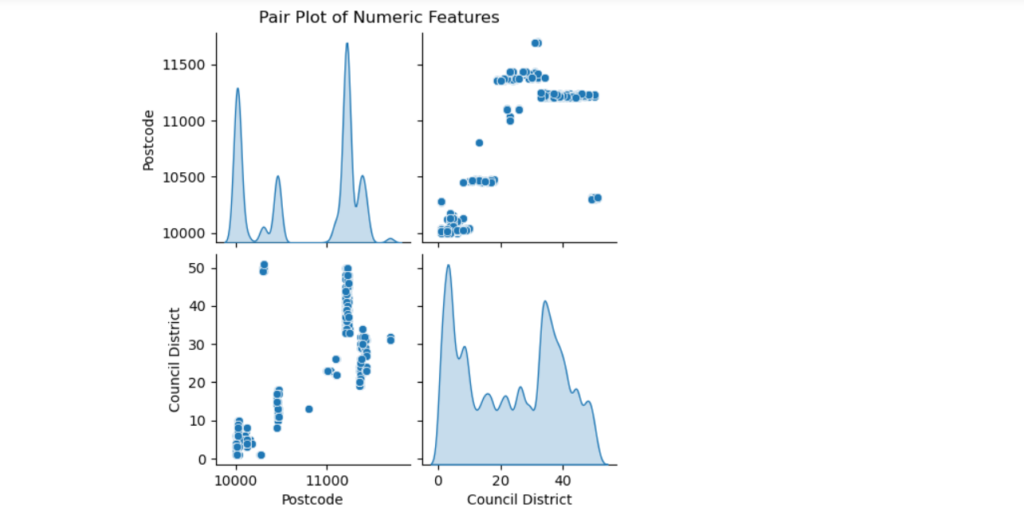
- A correlation matrix was created to determine the correlations between numerical variables. The correlation heatmap visualized these interactions, emphasizing any strong positive or negative correlations that could be important for model development and feature selection. For example, recognizing the relationship between parameters such as ‘Postcode’ and ‘Council District’ aided in the selection of key variables for modeling.
Visualizations:
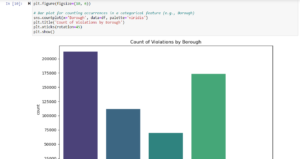
- To investigate the distribution and linkages within the data, multiple visualizations were created:
- Violin and Box Plots: These plots were used to compare the distribution of numerical variables, such as ‘Postcode’, across different boroughs, revealing information about data spread and skew.
- Pair Plot: This was used to depict the pairwise relationships between numerous numeric features, which allowed for a better understanding of their interdependence.
- Histograms and KDE plots: These were used to evaluate the distribution of specific numerical variables, providing insight into how data points are distributed over different ranges.
- These EDA methodologies revealed critical trends and potential predictors of safety violations, paving the way for more accurate and effective modeling.
Modelling:
Logistical Regression:
Accuracy = 0.1927217471927475
ROC AUC Score: 0.9186424756273674
Precision: 0.07112959585137628
F1 Score: 0.09775433830214723
Decision Tree Results:
Accuracy : 0.7609628790220117
ROC AUC Score: 0.9958149968163008
Precision : 0.7786652052696894
F1 Score : 0.7543815704365
Random forest classifier:
Accuracy : 0.7609628790220117
ROC AUC Score: 0.9958149968163008
Precision : 0.7786652052696894
F1 Score : 0.7543815704365
Recommendations:
Based on the information gained by EDA and prediction models:
- Targeted Inspections: Focus greater resources on checking areas and buildings with a high frequency of previous infractions. Predictive models can help to prioritize these examinations.
- Enhanced Training Programs: For building managers and contractors in high-violation areas, providing more rigorous training on safety standards and compliance may prevent future violations.
- Policy Changes: Consider changing regulations or implementing harsher enforcement procedures in places where certain types of infractions are common, as identified by our analysis.
- Data-Driven Decision Making: The DOB should continue to use machine learning algorithms to anticipate and prevent safety infractions proactively, resulting in better building practices throughout the city.
Conclusion:
- The analysis of DOB safety infractions has provided useful insights into the trends and factors that influence building safety compliance in New York City. We were able to forecast violations with reasonable accuracy using machine learning models, implying that predictive analytics can play an important role in enhancing building safety. Moving forward, the DOB can use these data-driven ways to maximize its resources, improve safety standards, and ultimately reduce the number of safety infractions in the city.
